BALTIMORE (Stockpickr) -- Keep your hands and feet in the car at all times. It's pretty clear we're roller coaster market right now -- and it's picking up speed.
>>5 Stocks Insiders Love Right Now
No, that doesn't mean that stock market volatility is running rampant in April. In fact, most volatility measures remain at historically low levels as I write. The real violent swings aren't showing in the price action -- they're showing up in investor sentiment and anxiety. From one week to the next, sentiment data indicate that investors are changing their stance on stocks. And that's precisely when you need to watch out.
A big part of that investor paranoia comes from the fact that, within the last month, the momentum names that had been working the best for investors in 2013 suddenly got unloaded en masse. Even though it may feel like that was an abrupt change in market leadership, it wasn't. The technical picture continues to provide early warnings for which stocks to shed -- and which to buy with both hands.
And right now, the buy signals are flashing in some of Wall Street's biggest names. To take advantage of them, we're turning to the charts.
>>4 Big Stocks on Traders' Radars
If you're new to technical analysis, here's the executive summary.
Technicals are a study of the market itself. Since the market is ultimately the only mechanism that determines a stock's price, technical analysis is a valuable tool even in the roughest of trading conditions. Technical charts are used every day by proprietary trading floors, Wall Street's biggest financial firms, and individual investors to get an edge on the market. And research shows that skilled technical traders can bank gains as much as 90% of the time.
>>5 Rocket Stocks Ready for Blastoff
Every week, I take an in-depth look at big names that are telling important technical stories. Here's this week's look at five high-volume stocks to trade this week.
Berkshire Hathaway
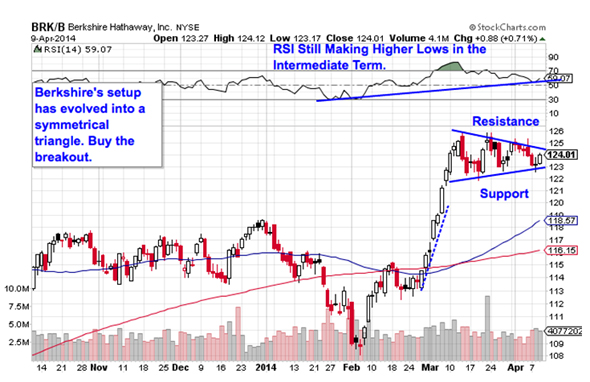
Just a couple of weeks ago, Berkshire Hathaway (BRK.B) was waving the warning flag -- shares looked "toppy" after a big move higher in February and early March. But that setup has evolved into something that looks a lot more constructive for Berkshire bulls ahead of the firm's shareholder meeting in May. So if you missed the 11% move in this stock since Feb. 1, we're coming up on another solid buying opportunity.
Berkshire Hathaway has been grinding sideways in a symmetrical triangle, or "coil" pattern, for the last few weeks, bouncing its way sideways between a pair of converging trend lines. Consolidation patterns such as the symmetrical triangle are common after big moves -- they give investors a chance to catch their breath and figure out their next step. The buy signal comes on a breakout to the topside of the pattern, currently right at the $125 level. If shares can catch a bid above $125, then we've got a strong indication that buyers have regained control of shares.
Berkshire's stock momentum, measured by 14-day RSI, adds some extra confidence to this setup. In spite of the sideways movement this past month, RSI is still making higher lows in the intermediate term. That uptrend in our momentum gauge favors an upside breakout over a move lower in April.
Reed Elsevier
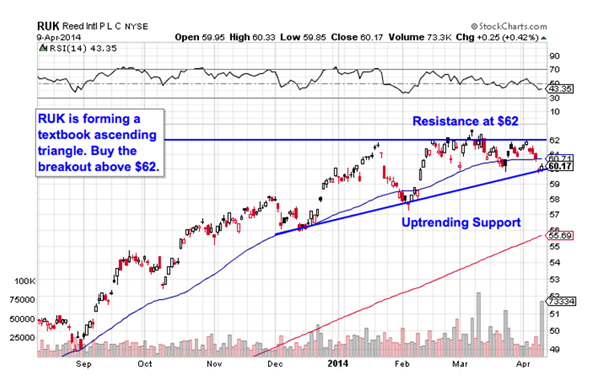
$17 billion UK-based information solutions firm Reed Elsevier (RUK) is another name that's fared well for the past half-year. Since September, shares of RUK have rallied more than 23%, besting the S&P 500's already impressive performance over that stretch. So does it make sense to buy here?
RUK is currently forming a triangle trade of a different sort: an ascending triangle. The pattern is formed by a horizontal resistance level above shares at $62 and uptrending support to the downside. Basically, as RUK bounces in between those two levels, it's getting squeezed closer to a breakout above that $62 resistance line. When that price breakout happens, it's time to join the buyers in this stock.
This isn't the first time RUK has been an ascending triangle trade. We looked at the exact same setup in shares last May, when this stock was bumping up against $47. The fact that RUK has previously broken out of the same pattern successfully bodes well this time around. That said, it's critical to wait for $62 to get broken before putting money on this trade; it's not a high probability setup until then.
Nike
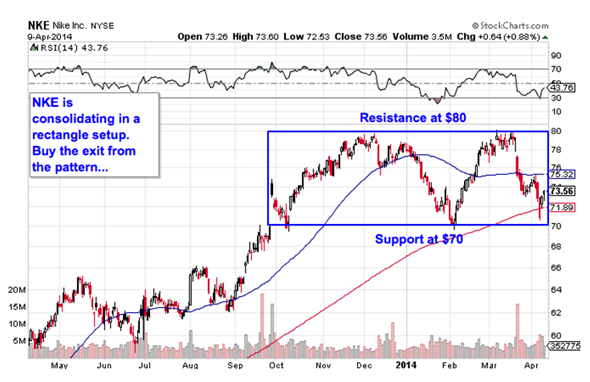
Nike (NKE) hasn't posted very inspiring performance over the last six months. Shares of the $65 billion apparel giant have only managed to fight their way 3.7% higher over that stretch, underperforming the S&P's 13% rally by a big margin. But that ho-hum performance could actually be the catalyst for a lot more upside in NKE for the next six months. Here's why:
Nike is forming a rectangle pattern, a price setup that's formed by a pair of horizontal resistance and support levels that basically "box in" shares between $80 and $70. Rectangles are "if/then patterns." Put a different way, if NKE breaks out through resistance at $80, then traders have a buy signal. Otherwise, if the stock violates support at $70, then the high-probability trade is a sell. Since Nike's price action leading up to the rectangle was an uptrend, it favors breaking out above $80.
Why all the significance at $80 in particular? It all comes down to buyers and sellers. Price patterns are a good quick way to identify what's going on in the price action, but they're not the reason a stock is tradable. Instead, the "why" comes down to basic supply and demand for Nike's stock.
The $80 resistance level, for instance, is a price where there has been an excess of supply of shares; in other words, it's a place where sellers have previously been more eager to step in and take gains than buyers have been to buy. That's what makes a breakout above $80 so significant -- the move means that buyers are finally strong enough to absorb all of the excess supply above that price level.
United Technologies
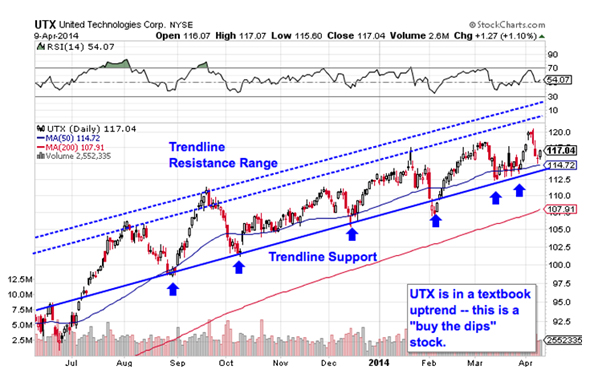
You don't need to be an expert technical analyst to figure out what's going on in shares of United Technologies (UTX) -- the setup in this industrial conglomerate is about as basic as it gets.
UTX is currently bouncing higher in a textbook uptrending channel. When it comes to channels, up is good and down is bad -- it's really just as simple as that. UTX's channel is bounded by resistance above shares and trend line support below them; those two parallel trend lines provide a high-probability range for shares of this stock to trade between. And so, as shares come up on trend line support for a sixth time since September, it makes sense to buy the bounce.
Waiting to buy off a support bounce makes sense for two big reasons: It's the spot where shares have the furthest to move up before they hit resistance, and it's the spot where the risk is the least (because shares have the least room to move lower before you know you're wrong). Remember, all trend lines do eventually break, but by actually waiting for the bounce to happen first, you're ensuring UTX can actually still catch a bid along that line before you put your money on shares.
Dish Network
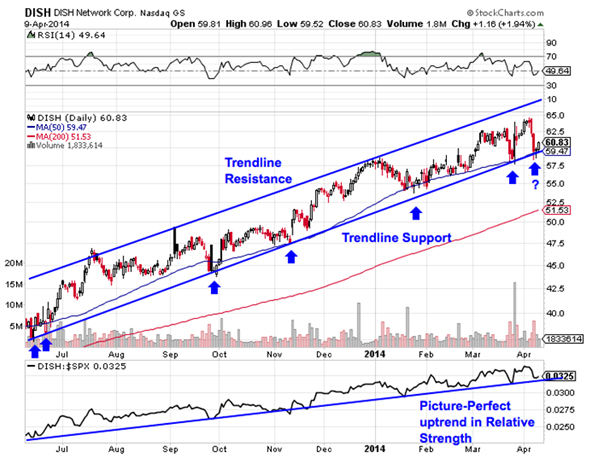
Last up on our list is Dish Network (DISH), a stock that's forming an uptrending channel identical to the one in UTX right now. Despite the fact that there isn't any overlap between the businesses at DISH and UTX, these two names have been very highly correlated for the last year -- and that means that you should trade each of them the exact same way.
DISH is testing trend line support this week, and shares bounced hard off of that support line yesterday. That makes DISH buyable in today's session. Relative strength continues to look exemplary in DISH right now, a very important indicator given the possibility of a more meaningful correction in the S&P from here. That relative strength line tells us that DISH is continually outperforming the S&P in good times and in bad ones.
If you decide to buy DISH's bounce in today's session, I'd recommend keeping a protective stop at the 50-day moving average. That level has been a solid proxy for support all the way up.
To see this week's trades in action, check out the Must-See Charts portfolio on Stockpickr.
-- Written by Jonas Elmerraji in Baltimore.
RELATED LINKS:
>>5 Ways to Profit From a Crowded Short Trade
>>5 Stocks Set to Soar on Bullish Earnings
>>5 Utility Sector Trades to Beat Wall Street
Follow Stockpickr on Twitter and become a fan on Facebook.
At the time of publication, author was long BRK.B.
Jonas Elmerraji, CMT, is a senior market analyst at Agora Financial in Baltimore and a contributor to
TheStreet. Before that, he managed a portfolio of stocks for an investment advisory returned 15% in 2008. He has been featured in Forbes , Investor's Business Daily, and on CNBC.com. Jonas holds a degree in financial economics from UMBC and the Chartered Market Technician designation.Follow Jonas on Twitter @JonasElmerraji
No comments:
Post a Comment