BALTIMORE (Stockpickr) -- Another trading session, another new all-time high in the big stock indexes. The high water mark for equities has been getting reset so frequently in the past couple of weeks that it's not even making headlines anymore. But stock picking still matters in this market; we're still far from the kind of irrationally exuberant market where you can buy anything and make money.
>>5 Stocks With Big Insider Buying
Instead, it still makes sense to stack the deck in your favor with the names that are likely to perform the best. To find them, we're turning to the charts for a technical look at five big-name setups to buy now.
If you're new to technical analysis, here's the executive summary.
Technicals are a study of the market itself. Since the market is ultimately the only mechanism that determines a stock's price, technical analysis is a valuable tool even in the roughest of trading conditions. Technical charts are used every day by proprietary trading floors, Wall Street's biggest financial firms, and individual investors to get an edge on the market. And research shows that skilled technical traders can bank gains as much as 90% of the time.
>>5 Tech Stocks to Trade for Gains
Every week, I take an in-depth look at big names that are telling important technical stories. Here's this week's look at five high-volume stocks to trade this week.
Delphi Automotive
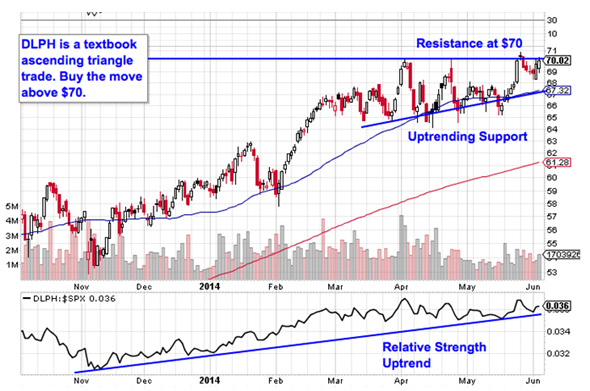
First up is Delphi Automotive (DLPH), the $21 billion auto parts supplier. Delphi has been a stellar performer for the past year, rallying more than more than 43% since June 2013. That's a lot more than its publicly traded clients can say. And after churning sideways for the last few months, Delphi looks ready for another leg higher this summer.
>>3 Stocks Under $10 Moving Higher
Delphi is currently forming an ascending triangle pattern, a bullish setup that's formed by horizontal resistance above shares at $70 and uptrending support to the downside. Basically as DLPH bounces in between those two technically-significant price levels, it's getting squeezed closer to a breakout above that $70 price ceiling. When that happens, it's time to be a buyer.
Relative strength adds some important backup for a buy signal in DLPH. That performance indicator has been in an uptrend since last summer, a signal that this stock is continually outperforming the S&P in good times and in bad ones. We could see the breakout trigger in the next few sessions. Keep a close eye on it.
Time Warner Cable
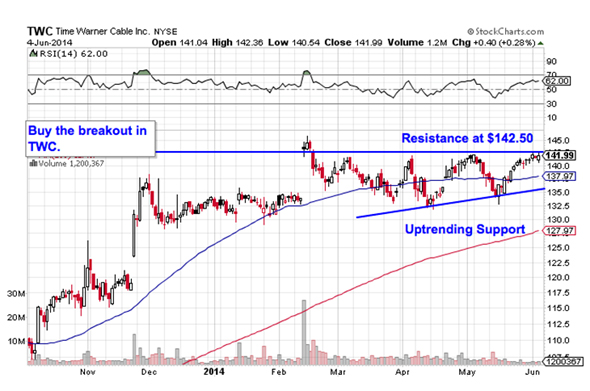
The exact same price setup is coming together in shares of Time Warner Cable (TWC). Like Delphi, Time Warner Cable is currently forming an ascending triangle pattern, in this case with resistance up at $142.50. A breakout above that level puts an end to the long-term sideways drag in this cable giant.
>>Sell These 5 Toxic Stocks Before It's Too Late
Why all of that significance at $142.50? It all comes down to buyers and sellers. Price patterns are a good quick way to identify what's going on in the price action, but they're not the actual reason a stock is tradable. Instead, the "why" comes down to basic supply and demand for TWC's stock.
The $142.50 resistance level is a price where there has been an excess of supply of shares; in other words, it's a spot where sellers have previously been more eager to step in and take gains than buyers have been to buy. That's what makes a breakout above $142.50 so significant -- the move means that buyers are finally strong enough to absorb all of the excess supply above that price level. Wait for shares to catch a bid above resistance before you buy it.
Honeywell
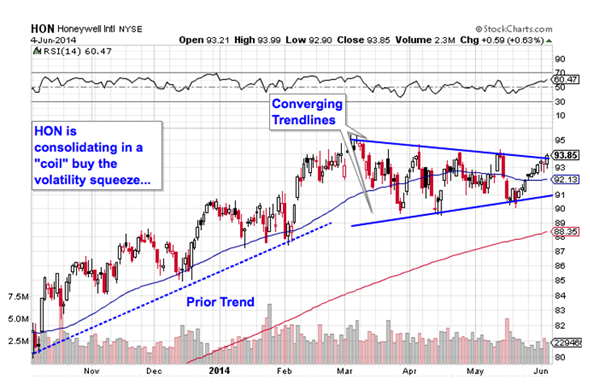
A triangle of a different sort is the setup to watch in shares of industrial name Honeywell (HON). Even though shares of HON have been moving lower since the beginning of March, there's a light at the end of the tunnel for investors. Here's how to trade it.
>>XXX
Top 5 Cheapest Companies To Buy Right Now
Honeywell has been grinding sideways in a symmetrical triangle, or "coil" pattern, for the last few months, bouncing its way sideways between a pair of converging trend lines. Consolidation patterns like the symmetrical triangle are common after big moves – they give investors a chance to catch their breath and figure out their next step. The buy signal comes on a breakout to the topside of the pattern, currently right at the $94 level. If shares can catch a bid above $94, then we've got a strong indication that buyers have regained control of shares.
The constricting action of Honeywell's symmetrical triangle is setting shares up for a volatility squeeze. Since volatility is cyclical, periods of very low volatility are typically followed up by a swing to high volatility. That means that HON's initial move is likely to be very fast. Don't miss it.
General Electric
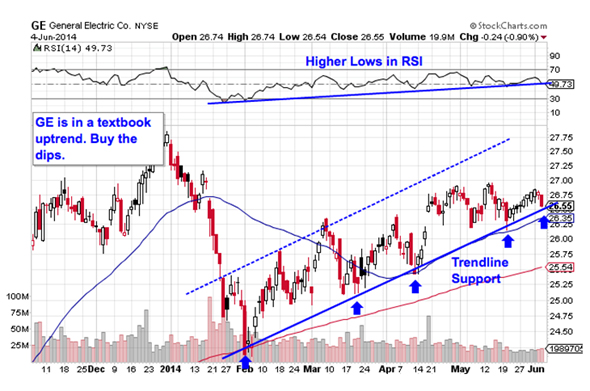
On the other hand, you don't need to be an expert technical analyst to figure out what's going on in shares of General Electric (GE). This chart is about as simple as they get. GE has been bouncing its way higher in an uptrending channel since the calendar flipped to February, leaving plenty of opportunities to be a buyer on the way up.
>>3 Huge Stocks Everyone Is Talking About
Put another way, GE is a "buy the dips stock" right now.
When it comes to price channels, up is good and down is bad -- it's really just as simple as that. GE's channel is bounded by resistance above shares and trend line support below them; those two parallel trend lines provide a high probability range for shares of this stock to trade between. So, with shares of the firm moving down to test support for a fifth time since February, it makes sense to buy the next bounce off of trend line support.
The 50-day moving average has been a stellar proxy for support going back to last fall. If you decide to be a buyer here, I'd recommend putting a protective stop below the 50-day.
Wells Fargo
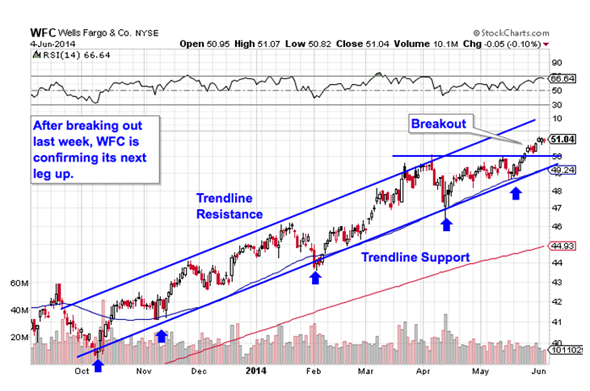
If you followed our list of big-name trades last week, then the chart of Wells Fargo (WFC) should look pretty familiar. After confirming the breakout above resistance at $50 last week, this name is resuming the uptrend that's been in play since back in October.
That means, if you missed the trade setup last week, you'll still get another chance to buy on this stock's next bounce off of trend line support. Waiting for that bounce to happen before buying is crucial, however: that's because it's the spot where shares have the furthest to move up before they hit resistance, and it's the spot where the risk is the least (because shares have the least room to move lower before you know you're wrong). Remember, all trend lines do eventually break, but by actually waiting for the bounce to happen first, you're ensuring WFC can actually still catch a bid along that line before you put your money on shares.
This bank has made some big moves in the last six months, but they don't look like they've over yet.
To see this week's trades in action, check out the Must-See Charts portfolio on Stockpickr.
-- Written by Jonas Elmerraji in Baltimore.
RELATED LINKS:
>>5 Utility Stocks Hedge Funds Love
>>3 Big-Volume Stocks in Breakout Territory
>>5 Hated Earnings Stocks You Should Love
Follow Stockpickr on Twitter and become a fan on Facebook.
At the time of publication, author had no positions in the names mentioned.
Jonas Elmerraji, CMT, is a senior market analyst at Agora Financial in Baltimore and a contributor to
TheStreet. Before that, he managed a portfolio of stocks for an investment advisory returned 15% in 2008. He has been featured in Forbes , Investor's Business Daily, and on CNBC.com. Jonas holds a degree in financial economics from UMBC and the Chartered Market Technician designation.Follow Jonas on Twitter @JonasElmerraji
No comments:
Post a Comment