BALTIMORE (Stockpickr) -- Earnings season is drawing to a close – that should help to yank some of the headline risk out of the stock market for the next month or two. And it's setting the stage for upside for the rest of the summer.
Over the course of this rally, earnings seasons have been a chance for the market to hold its breath. That's not hugely surprising; after all, this has been one of the most-hated equity rallies in history, so it makes sense that investors have braced for a smack-down each quarter during earnings.
Thing is, it hasn't happened. So as the broad market fuels up for another big move, it makes sense to take a technical look at the breakout trades forming infive of the biggest names on Wall Street. These are five must-see charts.
If you're new to technical analysis, here's the executive summary.
Technicals are a study of the market itself. Since the market is ultimately the only mechanism that determines a stock's price, technical analysis is a valuable tool even in the roughest of trading conditions. Technical charts are used every day by proprietary trading floors, Wall Street's biggest financial firms, and individual investors to get an edge on the market. And research shows that skilled technical traders can bank gains as much as 90% of the time.
Every week, I take an in-depth look at big names that are telling important technical stories. Here's this week's look at five high-volume stocks to trade this week.
SPDR S&P 500 ETF
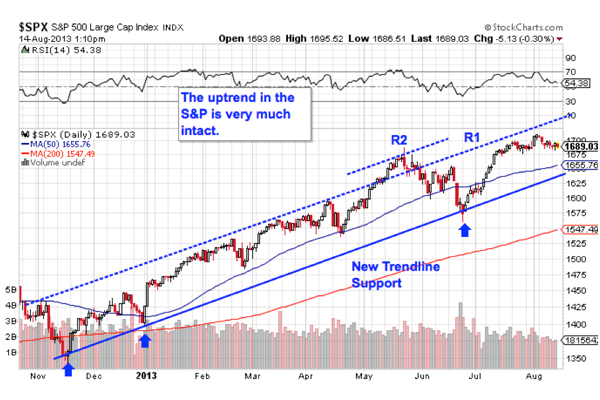
Up first, it makes sense to take a closer look at what's going on in the big picture: the S&P 500. To make it tradable, we'll use the SPDR S&P 500 ETF (SPY) as our proxy. At first glance, you don't have to be an expert technical trader to figure out what's going on in the big index; the S&P uptrend is still very much intact this month.
It's just not the same uptrend that SPY was in back at the start of the summer, but that's OK. While SPY may not be moving up at quite the same pace that it started at, the fact that this ETF is making higher highs and lows comes without question. Earnings season started on July 8, and as you can see from the chart above, the S&P has basically been consolidating sideways ever since. Consolidations are healthy for stock rallies, giving traders a chance to catch their breath and establish a base, and with earnings season ending, the uptrend looks likely to resume.
When stocks are trending higher, there really isn't a bad time to be a buyer -- but there is an optimal time. That optimal buying point comes when SPY bounces off of trendline support. Buying off a support bounce makes sense for two big reasons: it's the spot where shares have the furthest to move up before they hit resistance, and it's the spot where the risk is the least (because shares have the least room to move lower before you know you're wrong).
That's when I'd suggest picking up shares of this ETF.
Apple
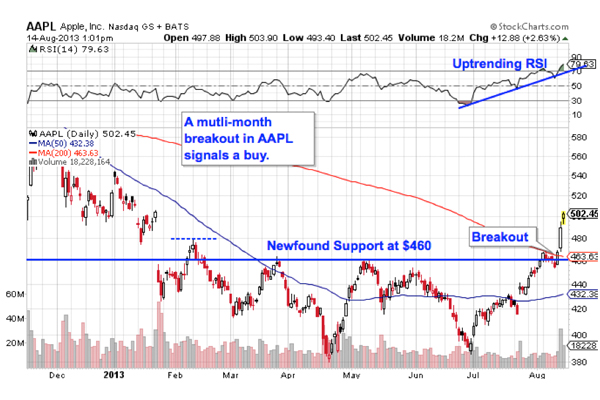
Apple (AAPL) has had a less impressive run in 2013. Shares of the tech behemoth are down around 6% since the calendar flipped over to January -- not horrific performance unless you consider the fact that the S&P 500 has gained more than 18% over that period. Ouch.
But Apple's bear run looks like it's nearing an end thanks to a multi-month breakout above the $460 level. Apple is breaking out of a double bottom pattern, a setup formed by two swing lows that take place at approximately the same price level. In AAPL's case, those swing lows bottomed out in late April and late June, and this week's breakout signals a buy.
Whenever you're looking at any technical price pattern, it's critical to think in terms of buyers and sellers. Rectangles, double bottoms and other price pattern names are a good quick way to explain what's going on in this stock, but they're not the reason it's tradable. Instead, it all comes down to supply and demand for shares.
That resistance line at $14.50, for example, is a price at which there was an excess of supply of shares; in other words, it's a place where sellers had been more eager to take recent gains and sell their shares than buyers were to buy. That's what made the move above it so significant -- the breakout indicated that buyers are finally strong enough to absorb all of the excess supply above that price level.
If you jump in here, I'd recommend putting a protective stop just below the 50-day moving average.
Chevron
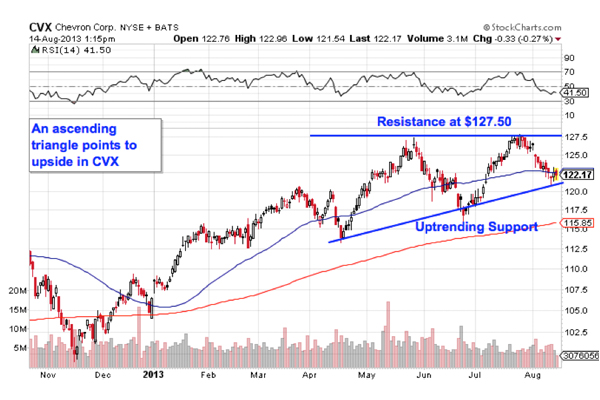
Oil and gas supermajor Chevron (CVX) is another name that's showing investors a bullish technical setup right now. Chevron is forming a textbook ascending triangle pattern, a price setup that we've seen a lot of on the way up in 2013. Here's how to trade it.
Chevron's ascending triangle is formed by horizontal resistance above shares at $127.50 and uptrending support below shares. Basically, as CVX bounces in between those two technical price levels, it's getting squeezed closer and closer to a breakout above $127.50. When that breakout happens, we've got our buy signal.
The energy sector spent the last quarter as a bit of a laggard, but it's been heating back up in the last month and change. With a breakout trade getting close to triggering here, Chevron offers one of the best-in-breed ways to play the trend this summer.
Green Mountain Coffee Roasters
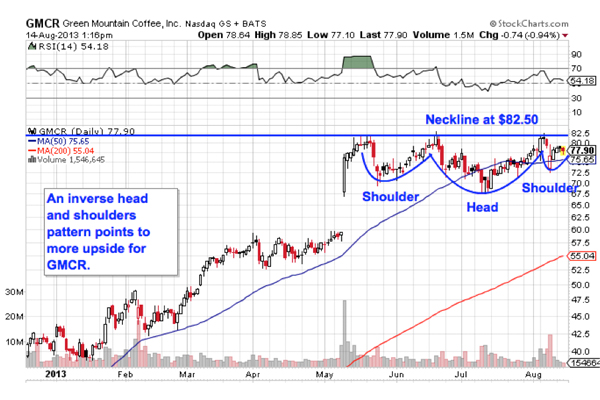
Last up is Green Mountain Coffee Roasters (GMCR), a stock that I wrote about yesterday as a potential short squeeze name. Besides the hefty shorting in GMCR (the short interest ratio sits at 11.4), this stock is also showing some technical strength right now, a combo that could magnify this stock's upside potential in the near-term.
GMCR has been forming an inverse head and shoulders pattern, a setup that's formed by two swing lows that bottom out at approximately the same price level (the shoulders), separated by a deeper swing low (the head). Typically, inverse head and shoulders patterns show up at the bottom of a stock's recent price action -- not the case here. Instead, GMCR's setup is showing up at the top of its recent price action. But as I mentioned, whether or not the pattern is "textbook" matters a whole lot less than the supply and demand forces causing it. Either way, the trading implications look good in GMCR right now.
Top 5 Low Price Stocks To Buy Right Now
The buy signal for Green Mountain comes on a breakout above its neckline at $82.50. When that level gets taken out, this stock becomes a high probability trade. From a risk-management standpoint, it makes sense to keep a protective stop just below the right shoulder.
To see this week's trades in action, check out this week's Must-See Charts portfolio on Stockpickr.
-- Written by Jonas Elmerraji in Baltimore.
No comments:
Post a Comment